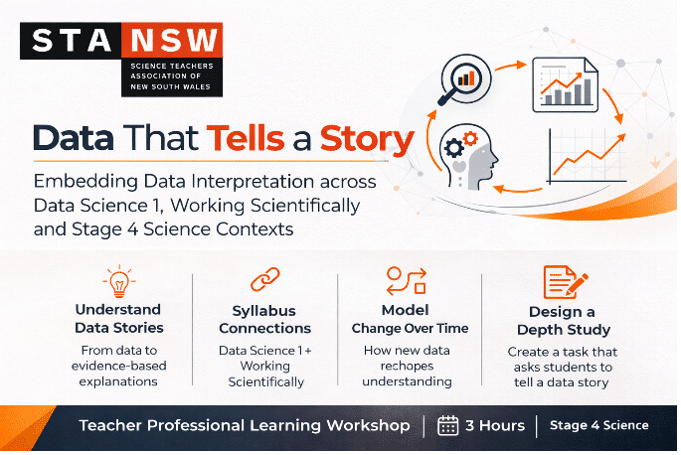
Data That Tells a Story: Embedding data interpretation across Data Science 1, Working Scientifically and Stage 4 Science contexts
Facilitator: Rebecca Collett, STANSW Teacher Fellow
Dates:
- In-person: Wednesdays 13th and 27th May 9:00 am – 12:00 pm.
- Online synchronous: Wednesdays 20th May and 3rd June 2026. 1:00pm – 4:00pm
Duration:
Three-hour stand-alone professional learning workshop
Modes of Delivery:
In person and live online via web conferencing.
This course can also be delivered as an in-school incursion. Availability is limited. For enquires email [email protected], with preferred timing, number of teachers and location.
Audience:
Secondary Science teachers (Years 7–8), faculty leaders and early-career teachers
Course Rationale
Data storytelling turns complex information into clear, engaging information with meaning. As data has become more abundant, more accessible, and easier to work with through human-friendly tools, it has moved well beyond specialist fields and into everyday communication. It combines data with visual and narrative techniques such as infographics, visualisations, interactive maps, and feature articles to help us understand patterns, insights, and implications. In a world saturated with information, data storytelling helps transform raw numbers into something useful, persuasive, and memorable.
Research in data science education indicates that students develop stronger, more transferable data skills by applying them in a range of contexts and real-world problems. In Stage 4 Science, this means giving students opportunities to create their own data stories contextualised within Focus Areas, for example Observing the Universe, Forces and Living Systems. Designing a data story provides students with the opportunity to access, organise, visualise, and describe patterns in data, that can then be linked to scientific explanations
Course Overview
This professional learning workshop is designed to provide teachers with explicit opportunities to explore the idea of a scientific data story, what it involves, and how to design learning that helps students move from reading data to using data as evidence. The workshop supports teachers to build that understanding and apply it directly to Stage 4 Science programming. Through syllabus alignment, task analysis and guided planning, participants will explore how students can use secondary data to identify patterns, compare model iterations, evaluate how scientific understanding has changed over time, and communicate a coherent data story within a nominated scientific context.
By the end of the workshop, participants will have developed a contextualised Stage 4 depth study outline that asks students to create a data story showing how new data reshapes scientific models.
Learning Intentions
By the end of this three-hour workshop, participants will:
- Build a clear understanding of what a scientific data story is, and how it differs from simple graph description or data display.
- Explore how Data Science 1 can be meaningfully linked with Working Scientifically and contextualised within Stage 4 Science focus areas.
- Examine how scientific models change over time as new data, technologies and scientific perspectives reshape explanation and understanding.
- Analyse an example Stage 4 depth study task, Patterns in the Sky: How New Data Reshapes Astronomical Models.
- Identify high impact teaching practices that help students interpret data, evaluate evidence, compare models and justify conclusions.
Use a practical planning scaffold to design their own Stage 4 Science depth study outline for later refinement and classroom use.
Success Criteria
Participants will know they have been successful if, by the end of the workshop, they can:
- Clearly explain the meaning of a scientific data story and how it goes beyond simply reading or displaying data.
- Make accurate links between Data Science 1, Working Scientifically, and a Stage 4 Science context.
- Show how scientific understanding changes when new data and new technologies become available.
- Critically evaluate the example depth study and identify what students would need to know and do to complete it successfully.
- Recognise teaching approaches that strengthen student interpretation, reasoning, and use of evidence.
Produce a workable outline for a contextualised Stage 4 depth study that can be refined for classroom use.
Structure
Part 1: Building understanding
- Welcome, goals and entry task
- What is a scientific data story?
- Syllabus links across Data Science 1, Working Scientifically and Stage 4 contexts
Part 2: Seeing the concept in action
- How scientific models change over time
- Analysis of the exemplar depth study
Part 3: Designing for classroom use
- High impact teaching practices
- Planning scaffold and task design guidance
- Independent depth study drafting
Reflection and next steps
| Short Course Dates | ||
|---|---|---|
|
Wednesday 13 May, In-Person |
9am – 12pm |
|
|
Wednesday 20 May, Online |
1pm – 4pm |
|
|
Wednesday 27 May, In-Person |
9am – 12pm |
|
|
Wednesday 3 June, Online |
1pm – 4pm |